
Anyone can create business dashboards
How to augment business users with dashboards written in natural language

Talk with your data
One of the use cases of AI chatbots is to act as a copilot to business users in their data analysis tasks. However, most of the time, this power is used in an ad hoc manner that barely scratches the surface of how companies can integrate generative AI into their data reporting workflows.
What most people do today
Ask your colleagues how they use AI to “talk with their data,” and the following scenarios prevail:
Microsoft Office Copilot. When looking at datasheets, users are presented with ideas on how to make the most of Excel’s table formatting and charting features. Those ideas are great, but they primarily focus on learning new ways to use Excel.
Dump data files into ChatGPT and ask it to analyze them. In this scenario, ChatGPT generally seeks to summarize the data, displaying totals and averages by category and identifying trends (e.g., growth, correlation). This can be helpful in making sense of large datasets, but without an understanding of the business, it rarely produces dashboards with genuine insights.
Use coding assistants to auto-complete or generate SQL queries. In my experience, this approach usually produces some helpful boilerplate queries, but it ultimately requires someone who can read and write SQL to finalize the analysis.
Chatbots integrated into data platforms. Many tech companies have already integrated chatbot assistants into their reporting interfaces. For example, you can use a chatbot to query your Google Cloud resource usage, your website traffic in Google Analytics, and blockchain activity statistics in Dune Analytics. However, such chatbots are usually limited to the specific context and data of the platform that offers them.
Most of these use cases are ad hoc. By contrast, within a company, most data analysis tasks are recurring and iterative. In other words, people produce daily, weekly, or monthly dashboards and refine them over time.
What businesses need
To enable business users to generate dashboards and insights from company data, a more holistic approach is needed.
The vision looks like this:
All company data is exported to a data warehouse of permissioned read-only database tables. Users have access only to the tables for which they are authorized, and they can generate queries against these tables without ever accessing the original business-critical databases that support the business.
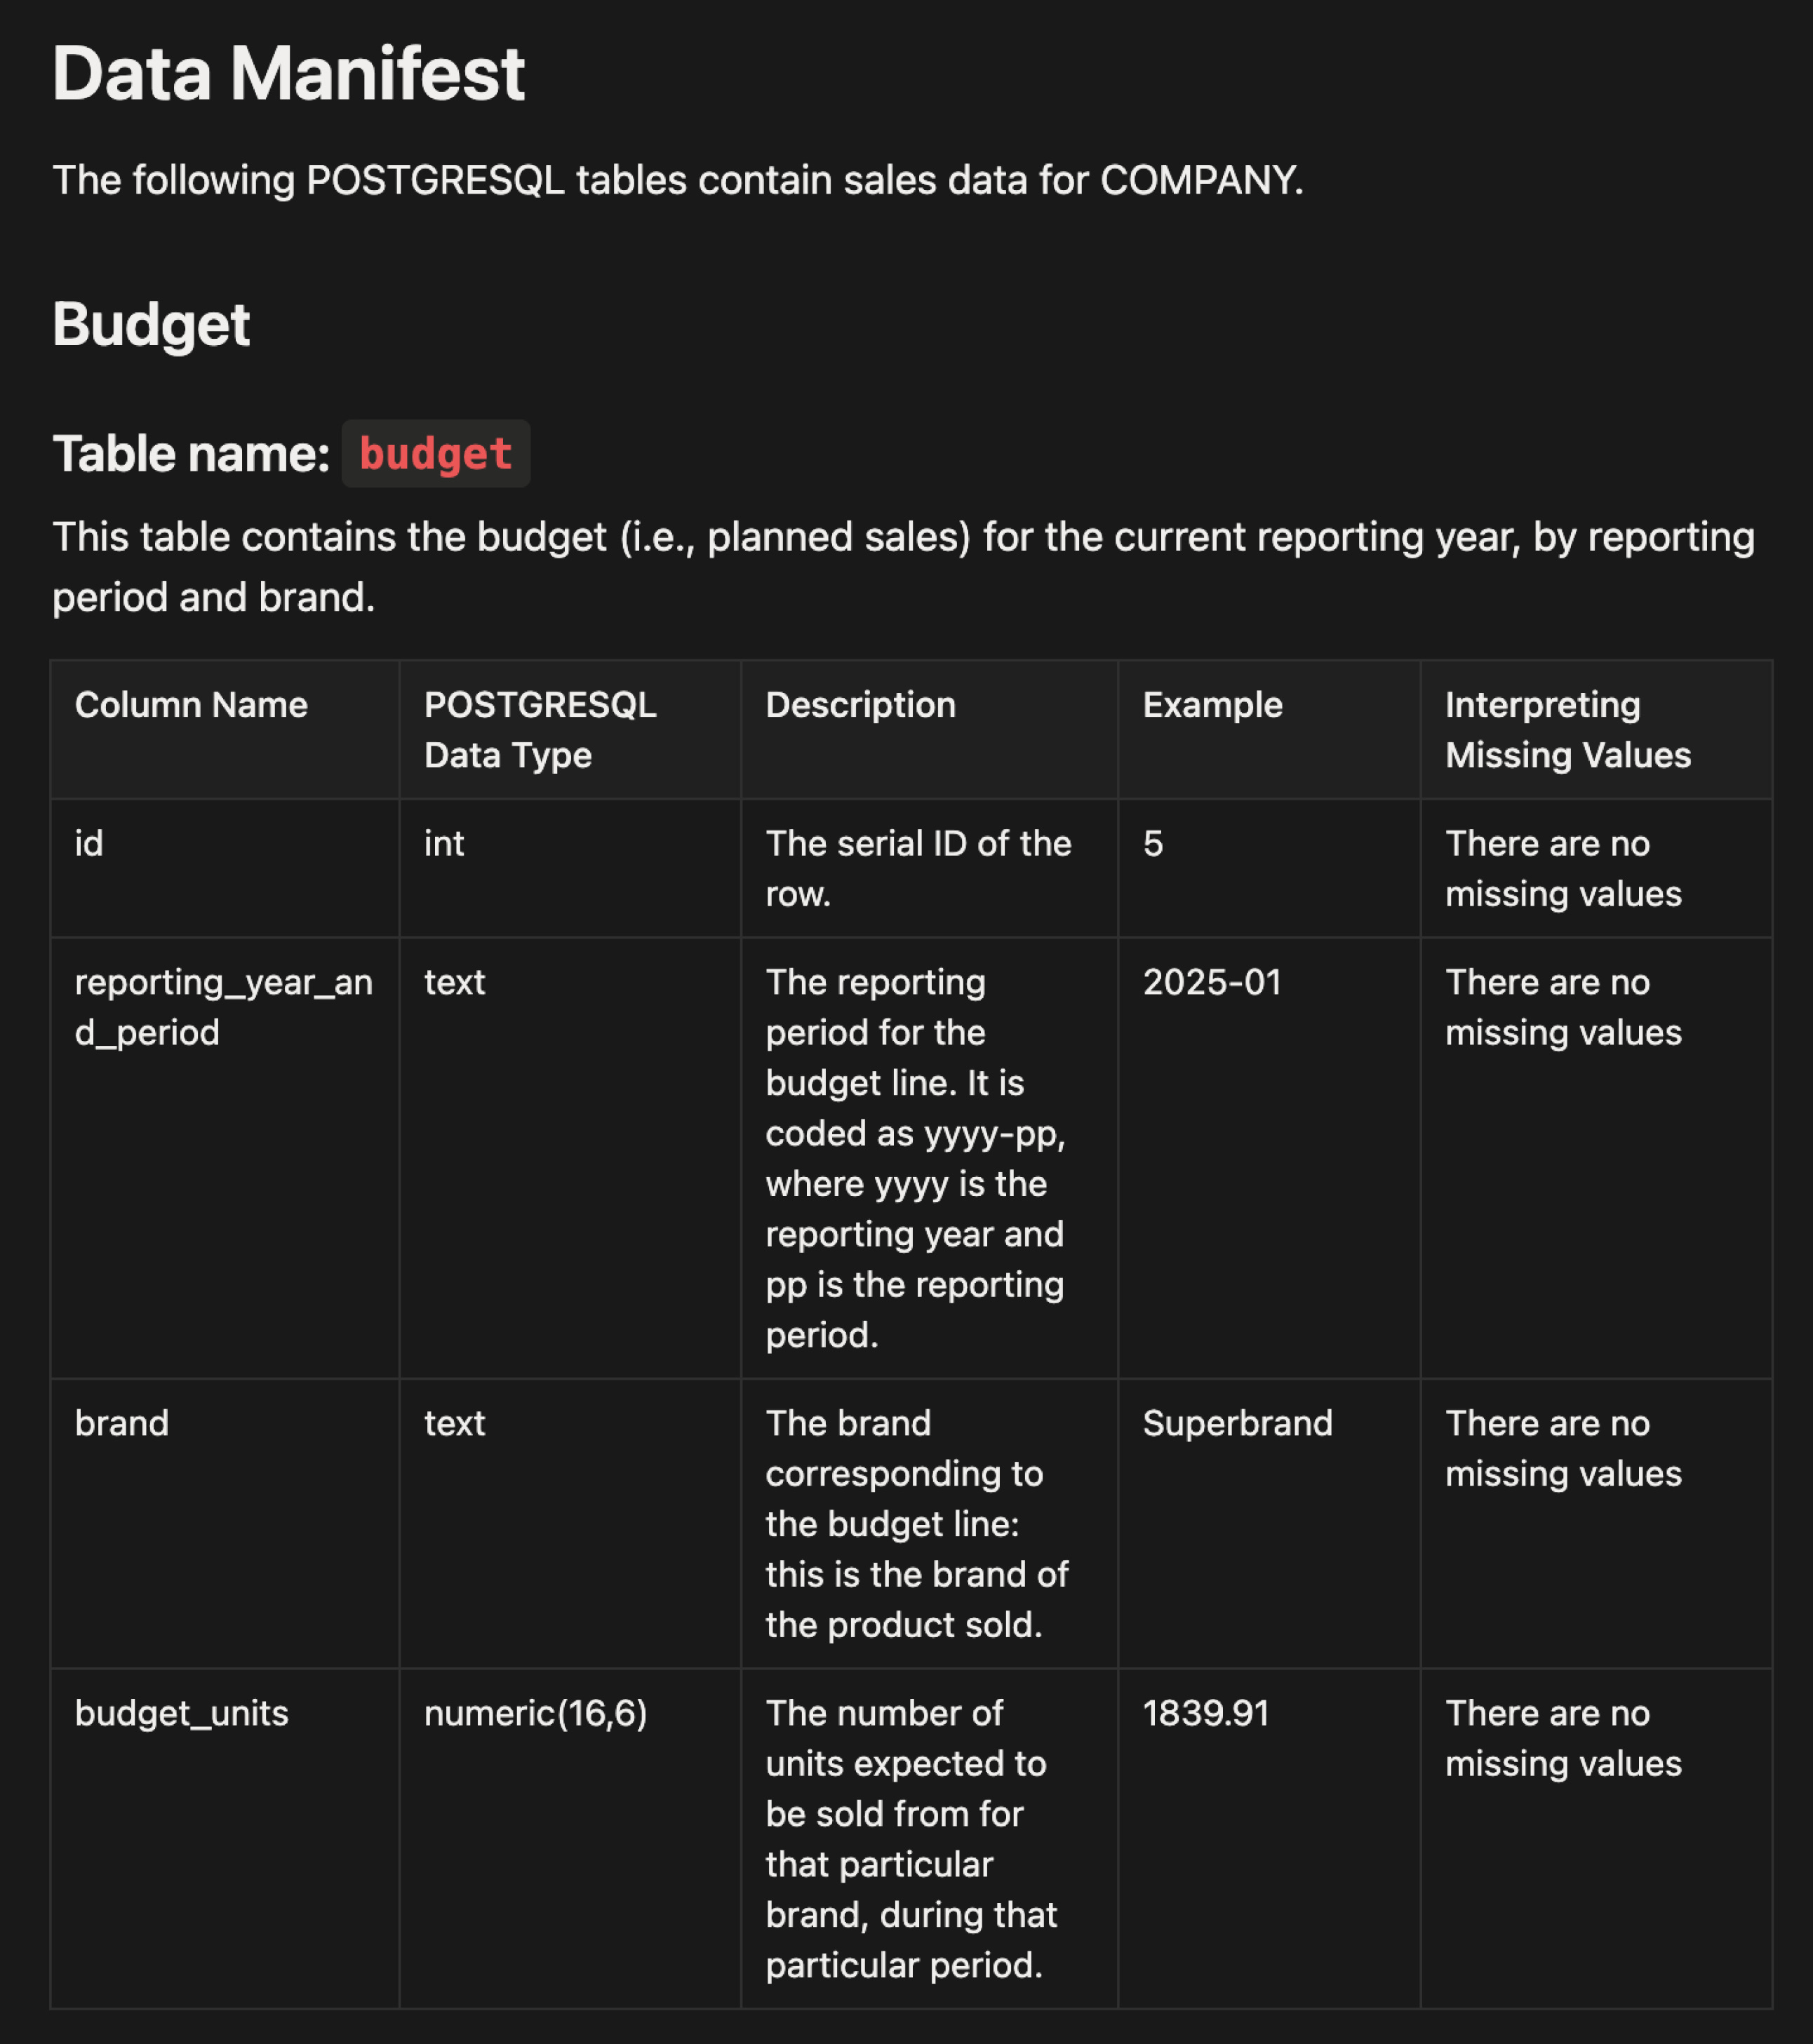
All data is described in natural-language “data manifests”. These are Markdown-formatted documents, where each table is described not only in terms of column definitions but also in terms of what each field means to the business.
Business users can request reports and dashboards in natural language. These requests are not isolated, ad hoc queries. They are collaborative documents that other business users can reuse or adapt to run their daily, weekly, or monthly analyses, and refine over time.
“Talk with your data”: making it happen
The “talk with your data” app typically uses standard components, but leverages data, data manifests, and report queries that are highly specific to your business.
It relies on:
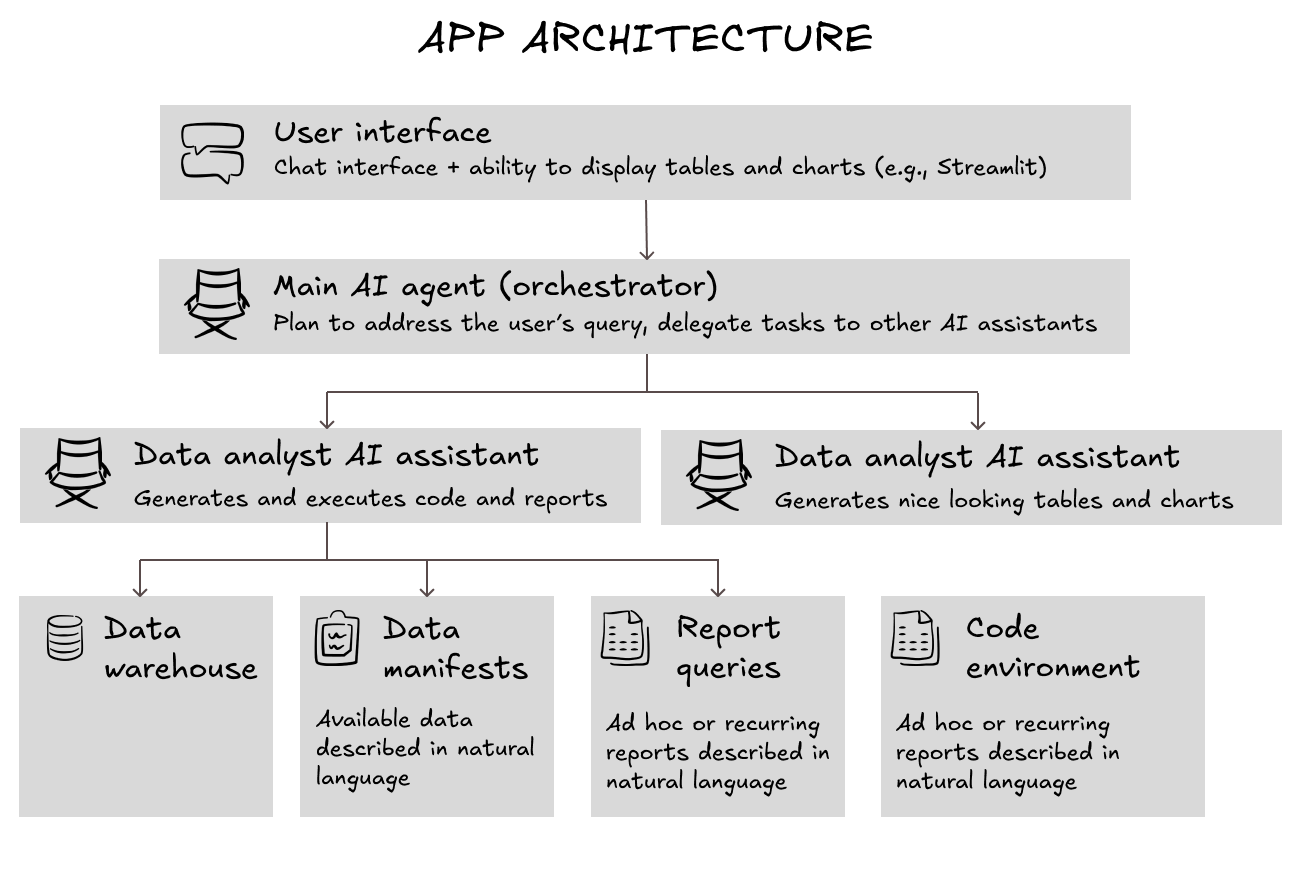
A chatbot-type interface where users can converse with an AI agent, but also see data reports and charts.
A collaborative document folder where data manifests and report queries are stored in natural language.
A main AI agent (the orchestrator), which plans how to respond to user queries and calls relevant tools.
A data analyst AI assistant, which can be called by the main AI agent to execute specific tasks as part of the overall plan, and has access to a standalone computer (a coding sandbox) where it can try out various queries to explore the data and generate requested reports.
A data presentation AI assistant, which can be called specifically to format reports in a user-friendly way according to the company’s standards. For example, it formats numbers, shades table cells green or red depending on whether they contain positive or negative growth rates, and so on.
Here is a visual representation of these components working together.
Let's review each component individually.
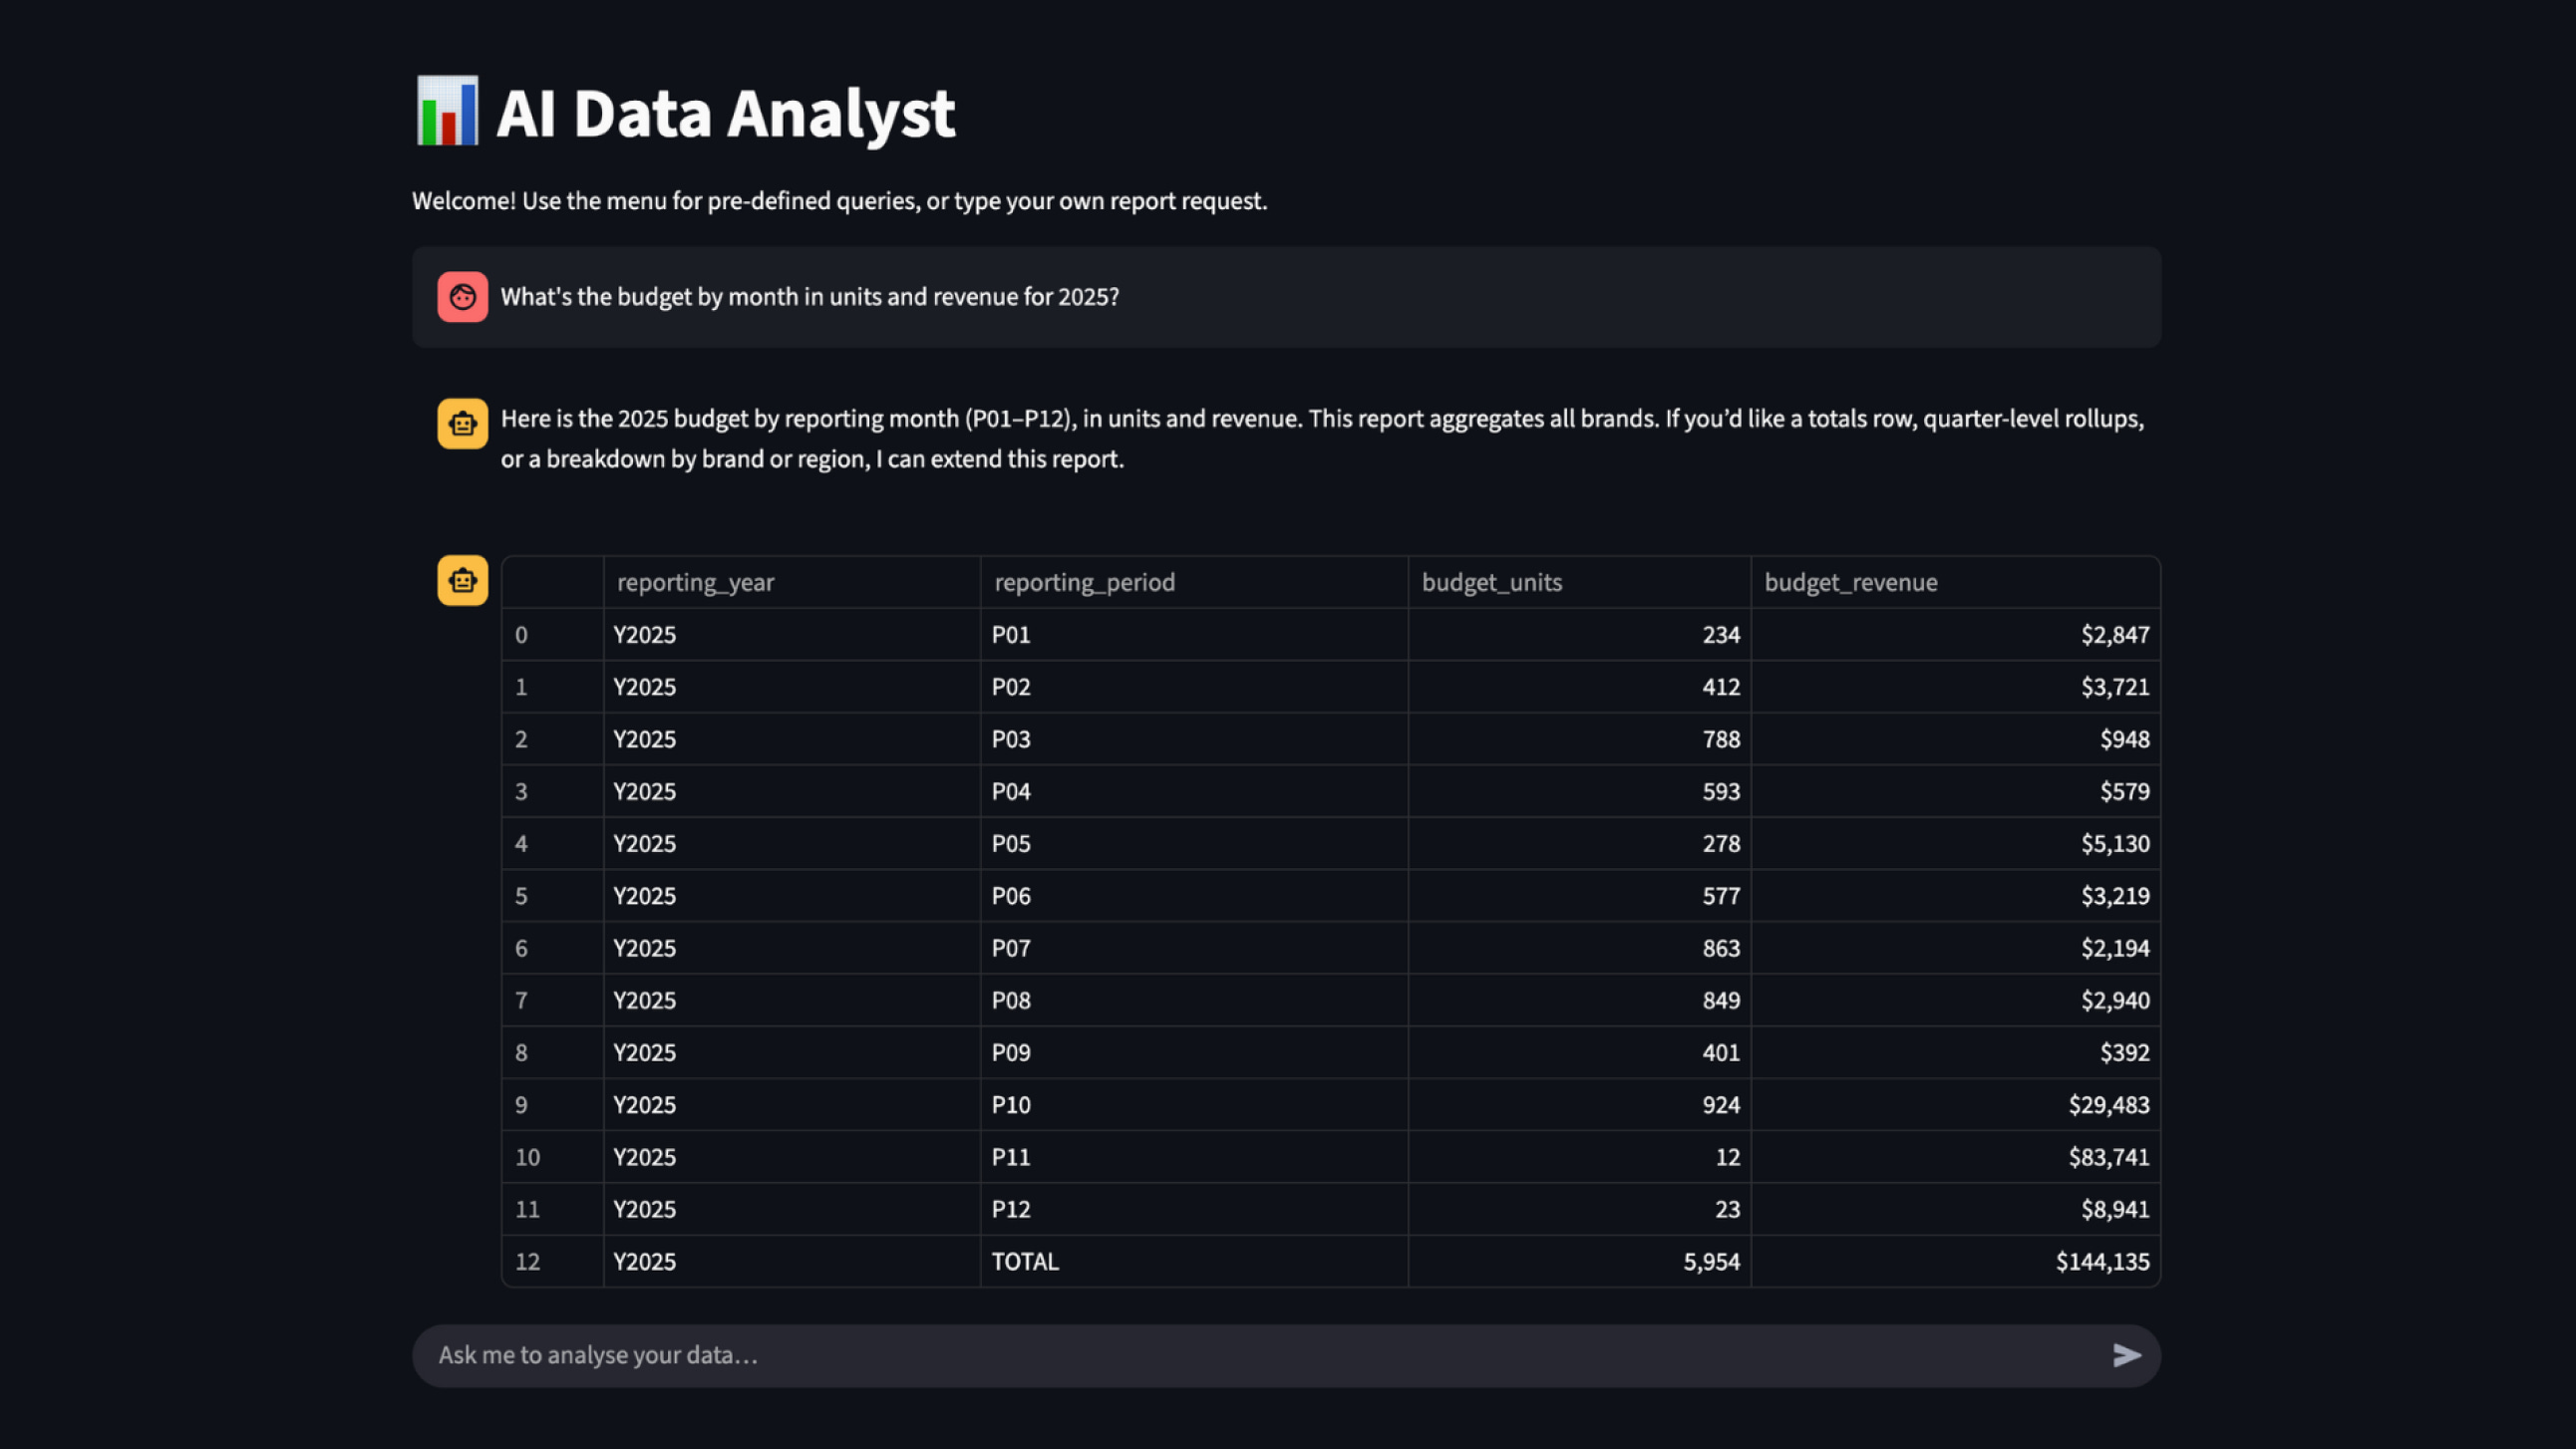
User interface
For internal company users, Streamlit is a great framework for implementing a chatbot while also displaying data tables and charts.
Here’s an illustration:
Data manifests and report queries
Data manifests and report queries are typically formatted in Markdown, a type of simple text format that existing documents can be easily converted into.
A data manifest describes the data and how it can be used. For example:
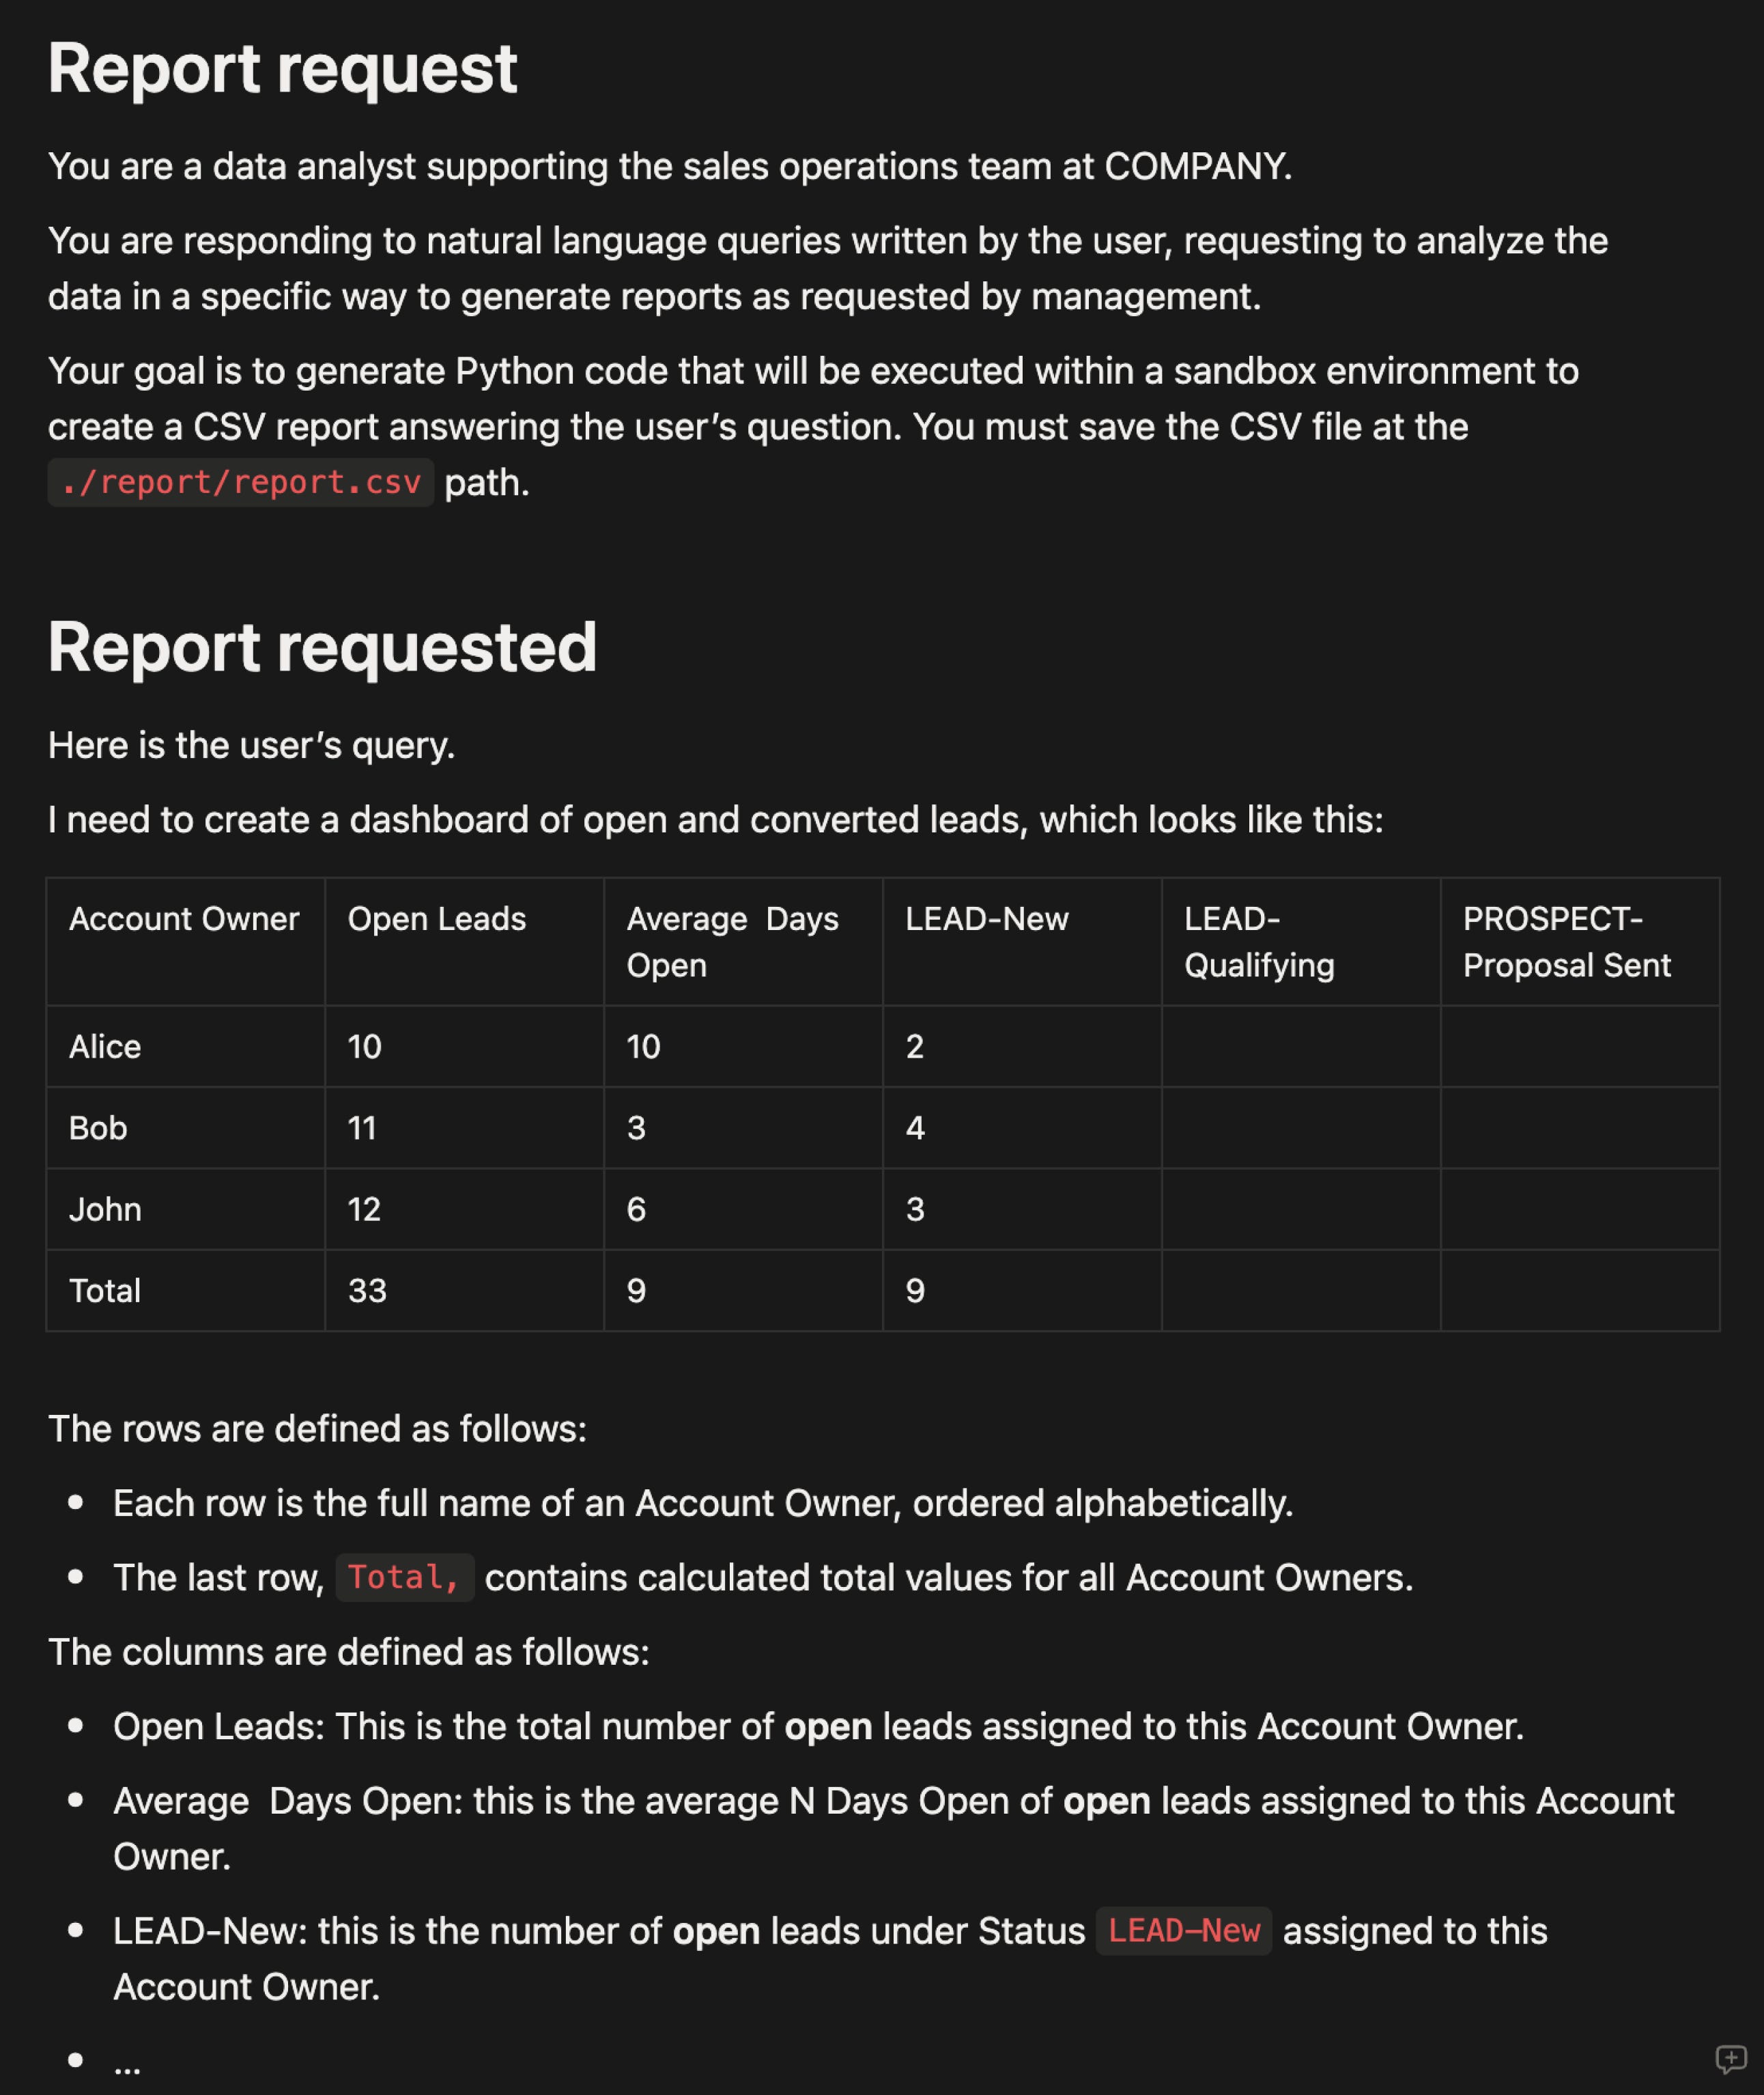
A report query describes the requested table in natural language, using examples and tables to make the description as concrete as possible:
The essential insight here is that data manifests and report queries are not ad hoc. They are maintained and refined over time to cover the business’s entire suite of daily, weekly, and monthly data reports and dashboards.
Main AI agent (the orchestrator)
The orchestrator agent’s primary task is to devise a plan to address the user’s query and review the work of the underlying assistants (data analyst assistant and data presentation assistant) to produce the exact report the user is requesting.
The orchestrator agent’s prompt looks like this:
# Overall context

You are a data analyst supporting the sales operations team at COMPANY.

You are responding to natural language queries written by the user, requesting to analyze the data in a certain way in order to generate reports requested by management.

Using available AI agents and tools, your end goal is to generate a **text response** that includes the following four sections:

-   Your plain text message to the user, which summarizes the status and results of your work, enclosed between the <plain_text> and </plain_text> tags.

-   The text content of the CSV file containing the report requested by the user, in comma-delimited format, enclosed between the <csv_report> and </csv_report> tags.

-   The full Python code that generates the CSV report answering the user's query and saves it under the `./report/report.csv` path. You will enclose this code between the <python_code_for_report_generation> and </python_code_for_report_generation> tags.

-   A Python code snippet that can be used to visualize the content of the CSV file as a user-friendly table in Streamlit, assuming that the CSV file has already been loaded into a Python Dataframe called `report_df`. You will enclose this code between the <python_code_for_streamlit_visualization> and </python_code_for_streamlit_visualization> tags.

# Responsibilities

Your workflow typically includes the following actions:

1. CREATE_PLAN: Understand the user’s query, clarify any ambiguous points, and create an execution plan.

2. EXECUTE_STEP: Execute a planned step yourself, such as updating some parts of the response in order to better answer the user’s query. At each step, you must maintain an up-to-date state and plan.

3. DELEGATE_STEP: Delegate a planned step to one of the available agents, such as REPORT_CODE_GENERATOR or STREAMLIT_CODE_GENERATOR. At each step, you must maintain an up-to-date state and plan.

4. REVISE_PLAN: Adapt your plan based on intermediate results, and go back to EXECUTE_STEP or DELEGATE_STEP if needed.

5. FINALIZE: When you are satisfied with the <plain_text>, <csv_report>, <python_code_for_report_generation>, and <python_code_for_streamlit_visualization> contained in the state, you can set the next_action to FINALIZE.

The EXECUTE_STEP and DELEGATE_STEP steps may be omitted or repeated several times, depending on the user's query and the output of previous steps.

…
Data analyst AI assistant
The data analyst assistant is an AI assistant that has access to a coding environment for experimentation and report generation.
E2B is a great platform for coding environments. You can pre-define Docker images that already include environment variables and the specific Python libraries available to the data analyst assistant, so that no time is wasted configuring the environment.
The data analyst assistant’s prompt looks like this:
# Overall context

Using available AI agents and tools, your end goal is to generate a **text response** that includes the following four sections:

-   Your plain text message to the user, which summarizes the status and results of your work, enclosed between the <plain_text> and </plain_text> tags.
-   The full Python code that generates the CSV report answering the user's query and saves it under the `./report/report.csv` path. You will enclose this code between the <python_code_for_report_generation> and </python_code_for_report_generation> tags.

# Workflow

## Workflow overview

You must follow the workflow steps described below:

1. **Explore**: using the `execute_python` tool as many times as needed, you execute POSTGRESQL queries to explore available data and their shape, determine what data you need for the report, and trial-run the code that generates a CSV report answering the user's query, until you are confident that you have generated Python code that produces the required CSV file and saves it under the `./report/report.csv` path.
2. Finalize: when you are satisfied that the Python code produces the required CSV file, you return your final response, including the <plain_text> content and the <python_code_for_report_generation> code.

## Using the `execute_python` tool

The `execute_python` tool executes your Python code within a single code cell in a Jupyter notebook, within a sandbox environment, and returns the output.

The sandbox environment has access to the POSTGRESQL tables described in the Data Manifest. To query the data tables, you must use the psycopg2 library, which is pre-installed in the sandbox environment. A connection string is provided in the DB_CONNECTION_STRING environment variable, which means that you can create a database connection with read-only permissions using the following code snippet:

```python
import os
import psycopg2
db_conn = psycopg2.connect(os.environ.get("DB_CONNECTION_STRING")
db_cursor = db_conn.cursor()
```

Typically, your code will query the POSTGRESQL tables to load the relevant data into Python DataFrames, and then manipulate these DataFrames to produce the required report.

The following libraries have been already installed into the environment using pip: pandas, numpy, openpyxl, pytz, psycopg2 and streamlit.
Data presentation AI assistant
If you are using Streamlit as the user interface, the data presentation AI assistant is just an assistant that’s focused on making your reports and charts look good in Streamlit.
Sometimes, the data presentation AI assistant won’t even be called by the main AI agent if the data is simple enough, because the main AI agent can generate basic visualizations directly.
The data presentation assistant’s prompt looks like this:
# Overall context

An AI assistant has generated a Python DataFrame called report_df, which answers the user’s query. The content of report_df is provided below in CSV format, between the <report_df_csv> XML tags.

Your task is to generate a Python code snippet that can be used to visualize the content of the report_df DataFrame as a user-friendly table in Streamlit.

The formatting instructions are provided below between <formatting_instructions> XML tags.

You will enclose your code response between the <python_code_for_streamlit_visualization> and </python_code_for_streamlit_visualization> tags.

Your code will be executed by the user within a Streamlit app using the `exec()` method to display the report as a DataFrame.

# Rules

Your Python code will be executed after the following lines of code, which therefore do not need to be included in your response:

```python
import streamlit as st
import pandas as pd
import numpy as np
import datetime
import json
st.set_page_config(page_title="Report", page_icon="📊", layout="wide")
st.title("Your report")
report_df = pd.read_csv("./report/report.csv")

```

At a minimum, your code should display the `report_df` DataFrame in the Streamlit app, so for example your response could be:

<python_code_for_streamlit_visualization>

```python
st.dataframe(report_df)
```

</python_code_for_streamlit_visualization>

To make the table more user-friendly, you should format large numbers with comma-separated thousands and zero decimals, and format percentages with the percent sign and zero decimals, so for example your response could look like:

<python_code_for_streamlit_visualization>

```python
styled_df = report_df.style.format(
    {
        "example_column_with_large_numbers": lambda x: f"${x:,.0f}",
        "example_column_with_percentages": lambda x: f"{x*100:.0f}%",
    }
)
st.dataframe(styled_df)
```

</python_code_for_streamlit_visualization>

However, the user may request specific formatting, in which case you will follow the user’s instructions.
Putting it all together
Here’s a video showing how the main AI agent receives a query and leverages available tools to generate a report for the user.
Note: the prompts shown in this blog post have been shortened and simplified for readability, compared with how they’ve been used on real-world projects.